What Pushed Me Past ¥60M ($387K) Wasn't 8 Years of Investing — It Was 3 Days in August
On Aug 3 my portfolio sat at ¥57.8M. On Aug 6 it hit ¥60.3M. What actually did it, and why I'm not moving my Barista FIRE date up.

Table of Contents
- Three days before I crossed ¥60M, I was at ¥57.8M
- Quick Japan context: I get hit by stocks and currency at the same time
- What actually happened in July
- Three days. ¥2.5M. Which is 6.8 months of my contributions.
- What I did when I crossed. Nothing.
- Right now I’m at ¥60.15M. The buffer is ¥150,000.
- Re-running the Barista FIRE math at ¥60M
- I’m not moving the date
- Tomorrow looks the same as yesterday
Three days before I crossed ¥60M, I was at ¥57.8M
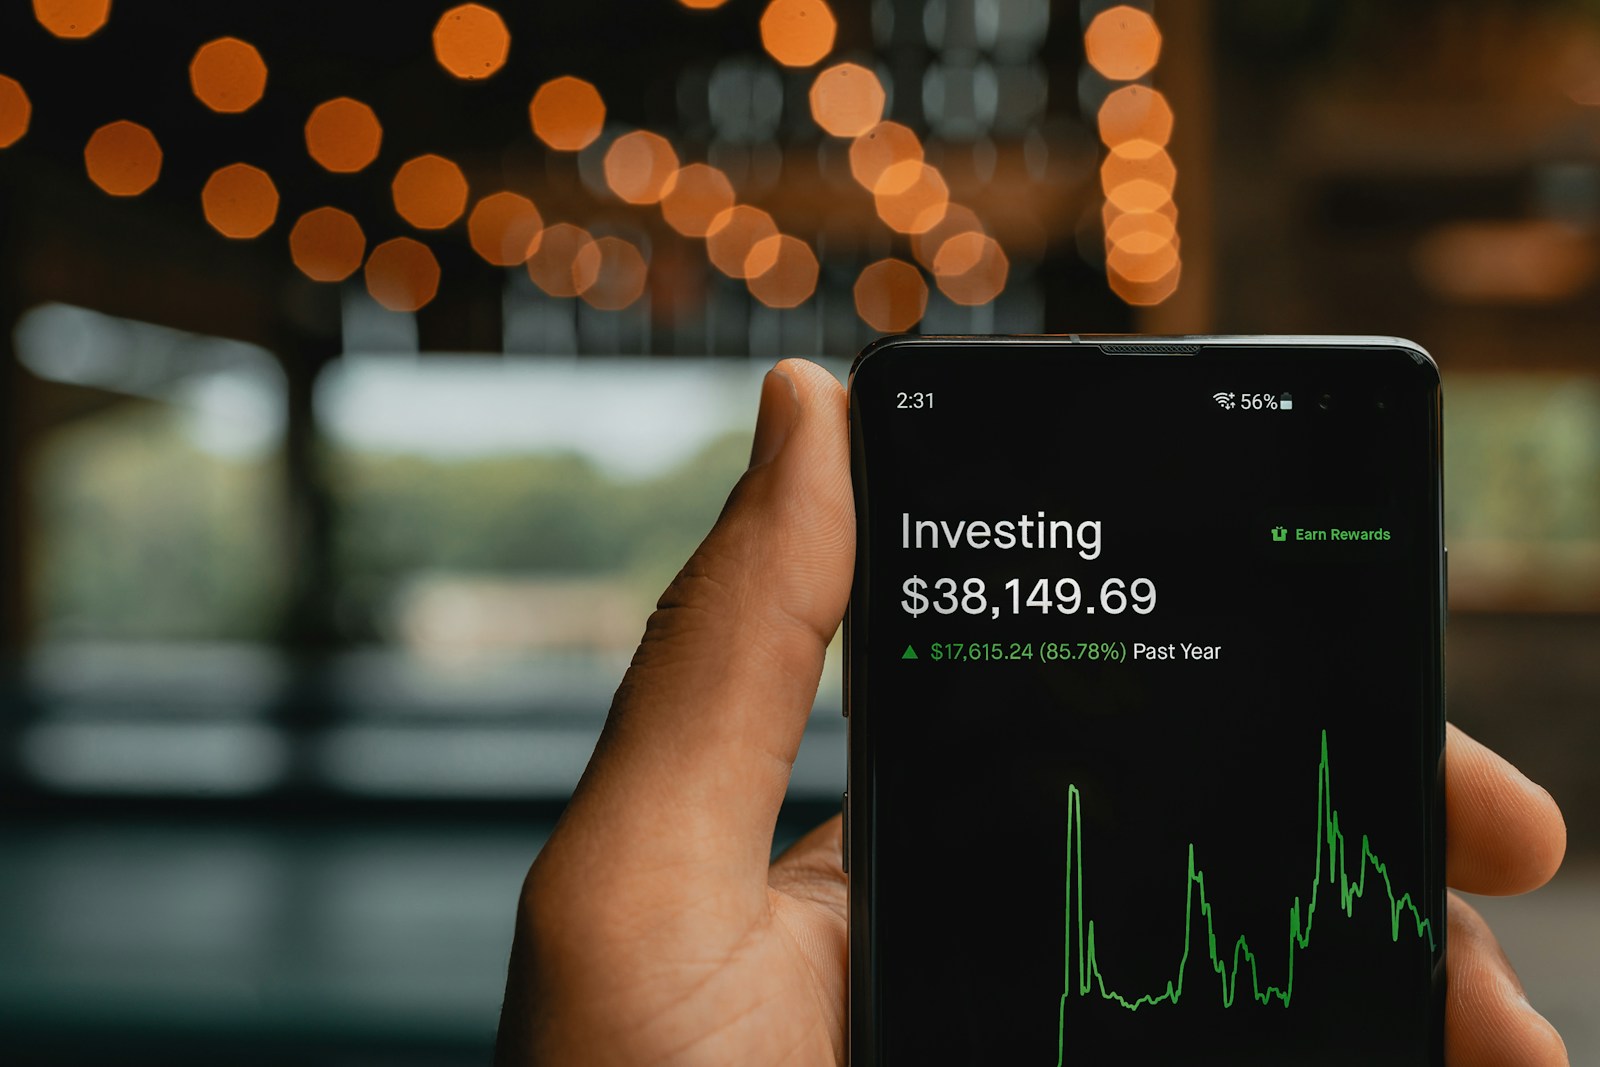
August 3, 2026. I opened my brokerage app and the number was ¥57.8M — about $373,000.
Back in June I wrote a post about being stuck between ¥58M and ¥59M, unable to touch ¥60M. Six weeks after publishing that, I was below the floor of the range I’d described.
I put in ¥370,000 (roughly $2,400) every month. My summer bonus landed in July and went in too. All that money going in, and the balance had gone backwards.
The market had eaten more than I’d fed it. That’s the whole explanation.
I checked the account every single day through that stretch. I’ve written before that when the number is down I close the app and pretend I didn’t look. In July I stopped doing that. I’m not sure why. Watching it slide had a certain grim entertainment value, I suppose.
Quick Japan context: I get hit by stocks and currency at the same time
If you invest from the U.S., your S&P 500 fund goes up when U.S. stocks go up. Simple.
My situation has an extra layer. My portfolio is mostly mutual funds holding U.S. equities, but my account balance is reported in yen. So two independent things move my net worth:
- What U.S. and global stocks do
- What the yen does against the dollar
A weaker yen inflates my balance even if stocks go nowhere. A stronger yen shreds it even if stocks rally. When both go against me, the drop is brutal, and there’s no fund I can pick that avoids it.
This is worth understanding if you ever wonder why Japanese investors talk about the exchange rate constantly. It’s not macro tourism. It’s half our portfolio’s volatility.
What actually happened in July
Some numbers, because otherwise this post is just bragging.
The Nikkei fell 8.13% over the month of July — its first monthly decline in four months. On July 24 it dropped 2.73% in a single session on AI-valuation nerves. On July 29 it hit 61,434, down roughly 15% from the 72,831 high it set on June 22.
The currency side was wilder. On July 23 the yen touched 163.99 to the dollar, the weakest it’s been since December 1986. About forty years. Eight days later, on July 31, Japan and the U.S. intervened jointly and the dollar dropped hard.
So: stocks down, then the yen strengthening on top of it. Both barrels. ¥57.8M.
That’s the first half of the story.
Three days. ¥2.5M. Which is 6.8 months of my contributions.
August 6, I opened the app and it said ¥60.3M — about $389,000.
Three days earlier it had been ¥57.8M. The gap is ¥2.5M, call it $16,100.
I assumed I’d misread a digit, closed the app, and opened it again. Same number. What I felt first wasn’t joy — it was a kind of loosening under the ribs, closer to relief than celebration.
Here’s what caused it, and it wasn’t me. The Nikkei that bottomed at 61,434 on July 29 rebounded to the 66,300 range by August 5. Nearly 5,000 points in a week. My three-day gain was just me sitting on top of that recovery.
To be clear: the July bonus is not in that ¥2.5M. The bonus went in and was invested before this window opened. So the ¥2.5M came with zero new money from me.
My monthly contribution is ¥370,000.
¥2.5M ÷ ¥370,000 = 6.8.
Three days of market did the same work as 6.8 months of my paycheck. For someone who has contributed every single month for eight years without missing one, that’s an awkward number to sit with.
And the reverse is just as true. Between June 20 and August 3 — six weeks — I fed in a monthly contribution plus a bonus, and my balance went down ¥200,000. Money in, balance down. Then money not in, balance way up. Neither had anything to do with my discipline.
What I did when I crossed. Nothing.
No selling. Contribution still ¥370,000. Cash allocation still 15%. No extra buying either.
In the June post I said the thought of trimming a little at the top never crossed my mind. But I wrote that before I’d ever touched the number, and I half suspected I was posturing.
Turns out it held. Honestly, the reason is less about willpower than about arithmetic — I couldn’t construct an argument for selling. “It hit a round number” is not a thesis. Not for an asset that moves 4% in three days.
My behavior didn’t change. My spending instincts did, a little, and that part I wrote about on Note instead.
Right now I’m at ¥60.15M. The buffer is ¥150,000.
September flipped the tape again.
The Nikkei closed at 64,325 on September 2, down from the August rebound high. The yen strengthened to the low 155s by September 4, with the Bank of Japan’s rate-hike odds doing the work.
Current balance: ¥60.15M. Around $388,000.
Which puts me ¥150,000 above ¥60M. About $970.
I’ve written that at this size, a 1% move is ¥600,000. So ¥150,000 is 0.25%. A quarter of one percent. That’s not a cushion, that’s rounding error — the market erases that between breakfast and lunch.
I haven’t landed on ¥60M so much as I’ve got my fingertips over the ledge.
In June I wrote that reaching ¥60M and living at ¥60M were completely different problems. I meant it as a prediction. Two and a half months later the numbers agree with me, which would feel better if being right paid anything.
Re-running the Barista FIRE math at ¥60M
In April I published a full plan to go Barista FIRE at 50. Barista FIRE, if the term’s new to you, means quitting the full-time job but keeping some part-time or contract income, so your portfolio only has to cover part of your life instead of all of it. I’d first run those numbers nine days earlier, at ¥50M, and been surprised how close it already was. That was five months ago. What sticks now isn’t that I’ve added ¥10M since — it’s that the version of me who ran those numbers wrote that he couldn’t bring himself to move.
The April assumptions:
- Portfolio at 46: about ¥50M ($323K)
- Monthly contribution: ¥370,000 ($2,400)
- Projected portfolio at 50: about ¥80M ($516K), assuming 7% annual returns
- Minimum viable number: ¥45M ($290K)
I’m 47 now, at ¥60.15M. Three years to 50.
So I ran it again. Yes, in Excel. My wife has opinions about this.

- Contributions alone: ¥370,000 × 36 months = ¥13.3M ($86K)
- If markets go absolutely nowhere: ¥60.15M + ¥13.3M = about ¥73.5M ($474K)
- At 7% annual: about ¥88M ($568K)
- If markets fall 5% a year: about ¥66M ($426K)
Even the ugly scenario clears the ¥45M minimum by a wide margin. Flat markets land me at ¥73.5M, a bit under the original ¥80M projection — but that gap is just April’s 7% assumption being optimistic, not the plan breaking.
Worth stressing: ¥60.15M is not ¥60.15M of spending money. The plan was never portfolio-only. After 50 the monthly income looks like this:
- My wife’s income: ¥240,000 ($1,550)
- My contract work: ¥200,000 ($1,290)
- Portfolio withdrawal: ¥280,000 ($1,800)
That’s ¥720,000 ($4,650) a month, and the portfolio is responsible for ¥280,000 of it. Annualized, ¥3.36M against ¥73.5M — a 4.6% withdrawal rate. Higher than the classic 4% rule, and it only works because my wife keeps working and I keep earning ¥200,000.
Also, 15% of the portfolio is cash — roughly ¥9M ($58K). ¥5M of that is an emergency fund I don’t touch under any circumstances. So the part actually working is closer to ¥51M.
On paper, the numbers say I could pull the date to 49. Maybe 48.
I’m not moving the date
No acceleration. Whatever the number does, it’s 50.
The reason is everything above.
I don’t control the number.
¥2.5M appears in three days. ¥200,000 vanishes over six weeks of diligent contributions. Put your goal inside that kind of noise and the goal starts moving on its own. Set the target at 49 because the math looked good in September, then watch a 15% drawdown put you right back where you started.
The date doesn’t do that. I turn 50 in three years no matter what the Nikkei does. It’s one of the very few things here I control — and honestly I don’t even have to control it, it just arrives.
So I moved the milestone from an amount to a date.
That’s probably the biggest change in how I think about any of this in eight years. Since somewhere around ¥30M — five or six years ago, I think — I’d been climbing a staircase of numbers. ¥50M next. ¥60M next. It took getting to ¥60M to actually feel that every step of that staircase is shifting by ¥600,000 a day underneath me.
When your target is an amount, good market days feel like progress and bad ones feel like failure. Eight years in, I’m fairly sure both feelings are noise.

Tomorrow looks the same as yesterday
I started this post intending to write “I hit ¥60M.” Somewhere in the middle it turned into “hitting ¥60M wasn’t my doing.” The conclusion changed on me while I was typing.
I don’t think the eight years were pointless. Without a ¥57.8M base, there’d have been nothing for those three days to land on. But if you zoom in on the moment the number crossed, my intent contributed exactly zero.
That’s probably the healthiest way to hold it.
If I’m back under ¥60M tomorrow, I’ll do the same thing anyway. Open the app on contribution day, confirm the purchase went through, close it. Thirty-six more times, and then I’m 50.
This part isn’t specific to Japan: if your milestone is a number the market sets, the market gets to decide whether you’re winning. Pick something you own instead.
I also wrote about the spending impulse that showed up after crossing ¥60M — and the thing I nearly bought and postponed to next year — over on Note.
Dollar figures use ¥155 = $1, roughly the rate during the period described. This post records my own experience and isn’t a recommendation of any specific investment or strategy. Your decisions are your own.
Related Articles
I Keep Getting Within a Hair of ¥60M ($400K) — and Keep Getting Knocked Back to $387K
My portfolio touches ¥59M, then slides back to ¥58M without crossing ¥60M. Why a bigger portfolio moves $4,000+ a day, and why I changed nothing.

Side FIRE / Barista FIRE at 50 with $330K Assets in Japan: A Full 3.5-Year Plan
Can you Barista FIRE at 50 with $330K? A 46-year-old Japanese salaryman runs the full math: assets, contract income, education costs, drawdown to 90.

Barista FIRE From Tokyo: A Japanese Salaryman Runs the Numbers at $330K in Assets
What Barista FIRE looks like from inside Japan's salaryman culture: real numbers, real constraints, and why the math surprised me